 Report and Dashboard
Data in HRBC can be analyzed visually,
workflow tasks can be identified
and backlogs improved.
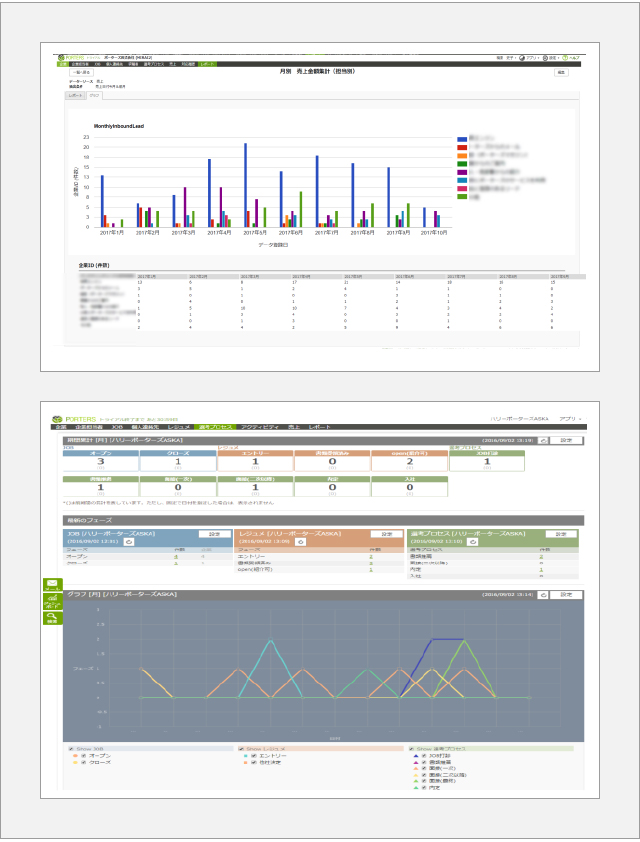
Report Function
A report of data that meets certain preset criteria can be created and downloaded in csv format of presented graphically. It is effective for acquiring aggregate and statistical data.
Dashboard Function
This is the function to display the number of items in JOB / Candidate / Each phase of the selection process and performance graph which helps to manage the company's KPI.
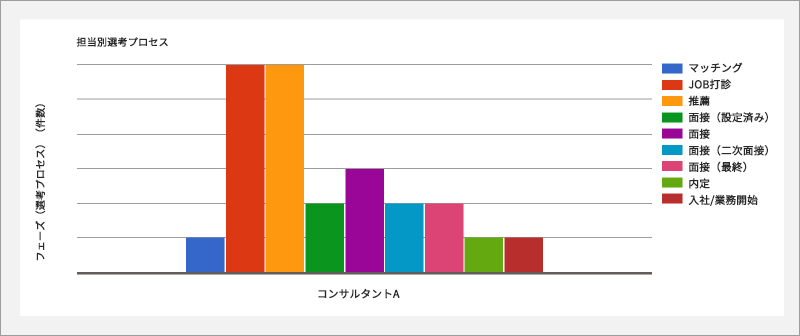
An incredible feature about the Report function is that unlike the export function, phase history including the past phases can be output. Therefore the success rate for document screening, the rate of each consultant’s progress on selection process and such kind of information can be reported by just one click. Additionally, it is also possible to set‘Not including' condition in the output criteria.
Furthermore, the results can be displayed in a graph or can be downloaded in csv format for further analysis using excel or other data analysis tools.
This is the function to display the number of items in JOB / Candidate / Each phase of the selection process and performance graph which helps to manage the company’s KPI. The dashboard is widely divided into 3 groups.
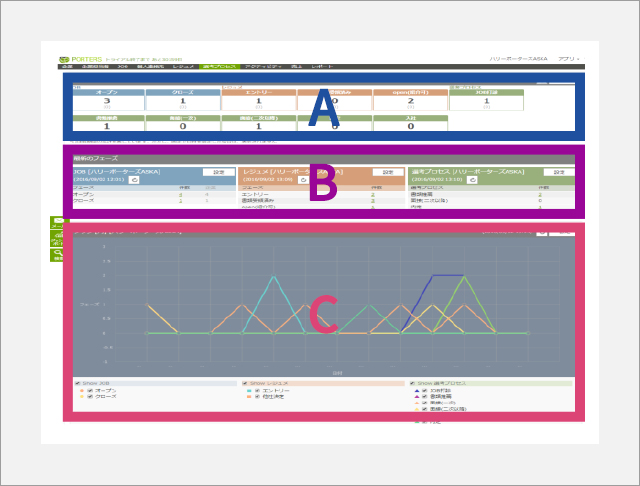
A. Number of Cumulative phase history items within a certain time period
B. Number of current phase items
C. Graphical display of number of cumulative phase history items for each target period
The cumulative figures for the previous period (previous week if it is cumulative for each week) are also displayed in A. Detailed selection of the users and period calculation is also possible. Real time data such as your records or those of your department, whole company and specific users can be visualized.


Business Hours: Weekdays 9am ~ 6pm(JST)
HR-Business Cloud is a comprehensive cloud-based Applicant Tracking System(ATS)/CRM for Recruitment Business.
HRBC greatly supports recruitment business in productivity improvement from small-scale to large-scale business, with high customization.
Porters Corporation is founded in 2001 in Japan, more than 1500 companies trust our product globally.
Porters Corporation
TODA BUILDING Aoyama 3rd floor 8-5-34 Akasaka , Minato-ku, Tokyo 107-0052 Japan
TEL: +81 3-6434-0017 | email: sales@porters.jp
![]()


![]()
Copyright (C) PORTERS Corporation All Rights Reserved.


